Session Analytics
VideoSDK's AI Agent framework offers powerful Tracing and Observability tools, providing deep insights into your AI agent's performance and behavior. These tools, accessible from the VideoSDK dashboard, allow you to monitor sessions, analyze interactions, and debug issues with precision.
Prerequisites
To View Tracing and Observability At VideoSDK Dashboard, make sure to install the VideoSDK AI Agent package using pip:
pip install videosdk-agents==0.0.23
Tracing and Observability support was added starting from version 0.0.23, which is why this version is required.
Sessions
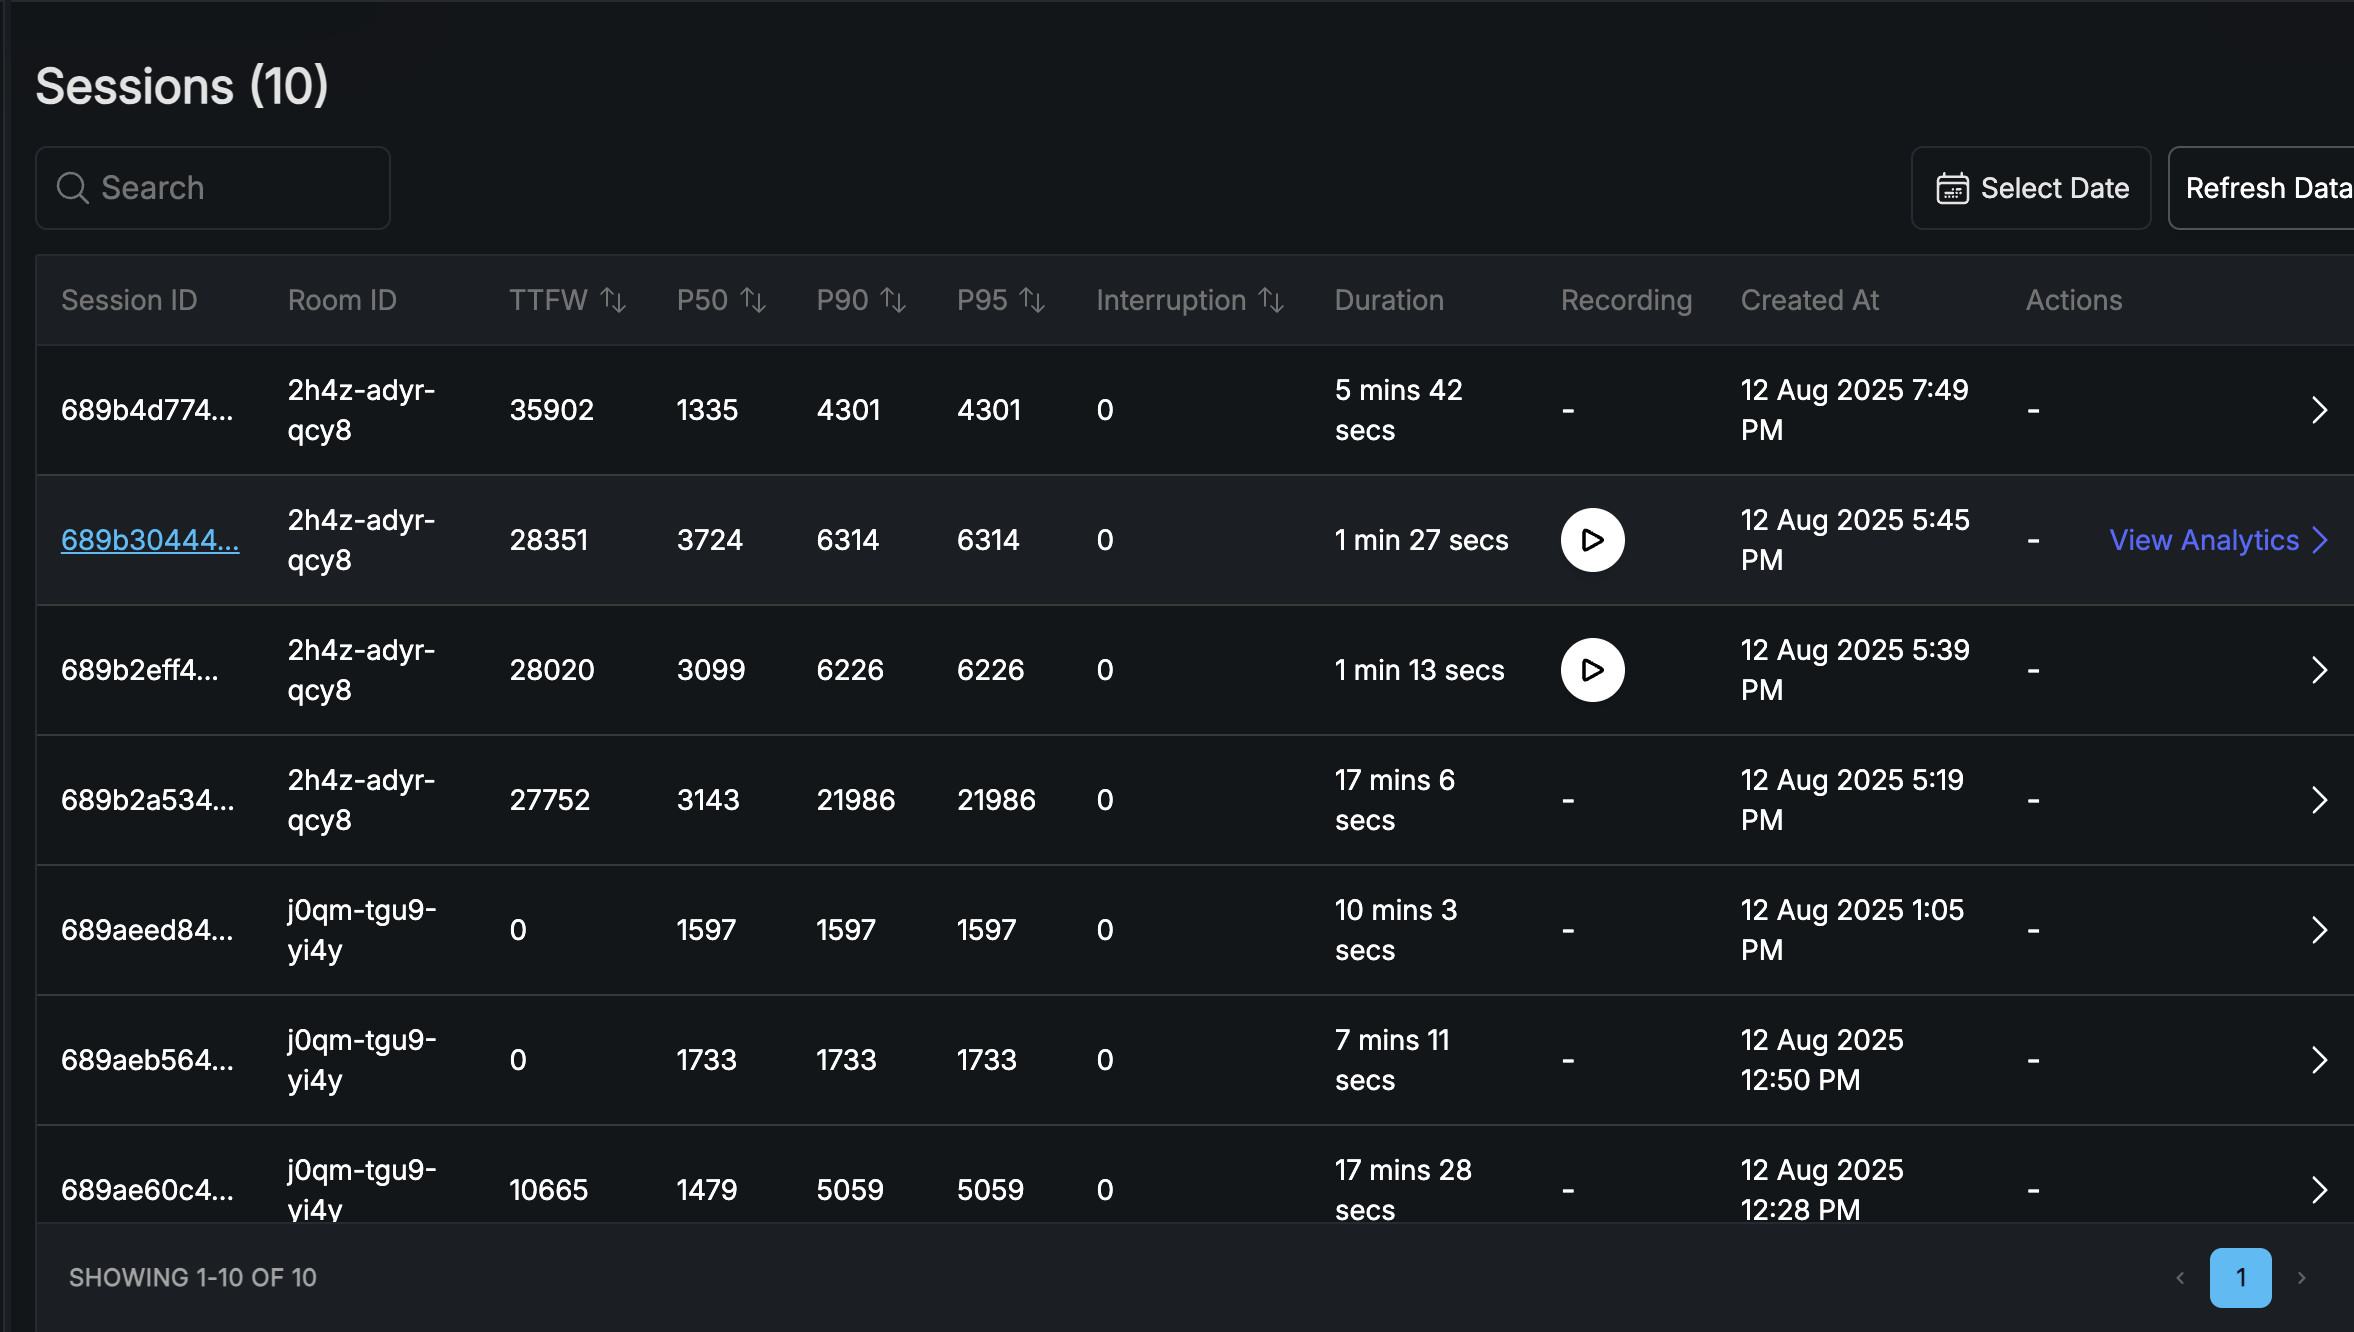
The Sessions dashboard provides a comprehensive list of all interactions with your AI agents. Each session is a unique conversation between a user and an agent, identified by a Session ID and associated with a Room ID.

Key Metrics
For each session, you can monitor the following key metrics at a glance:
- Session ID: A unique identifier for the session.
- Room ID: The identifier of the room where the session took place.
- TTFW (Time to First Word): The time it takes for the agent to utter its first word after the user has finished speaking. This metric is crucial for measuring the responsiveness of your agent.
- P50, P90, P95: These are percentile metrics for latency, providing a statistical distribution of response times. For example, P90 indicates that 90% of the responses were faster than the specified value.
- Interruption: The number of times the agent was interrupted by the user.
- Duration: The total duration of the session.
- Recording: Indicates whether the session was recorded. You can play back the recording directly from the dashboard.
- Created At: The timestamp of when the session was created.
- Actions: From here, you can navigate to the detailed analytics view for the session.
Session View
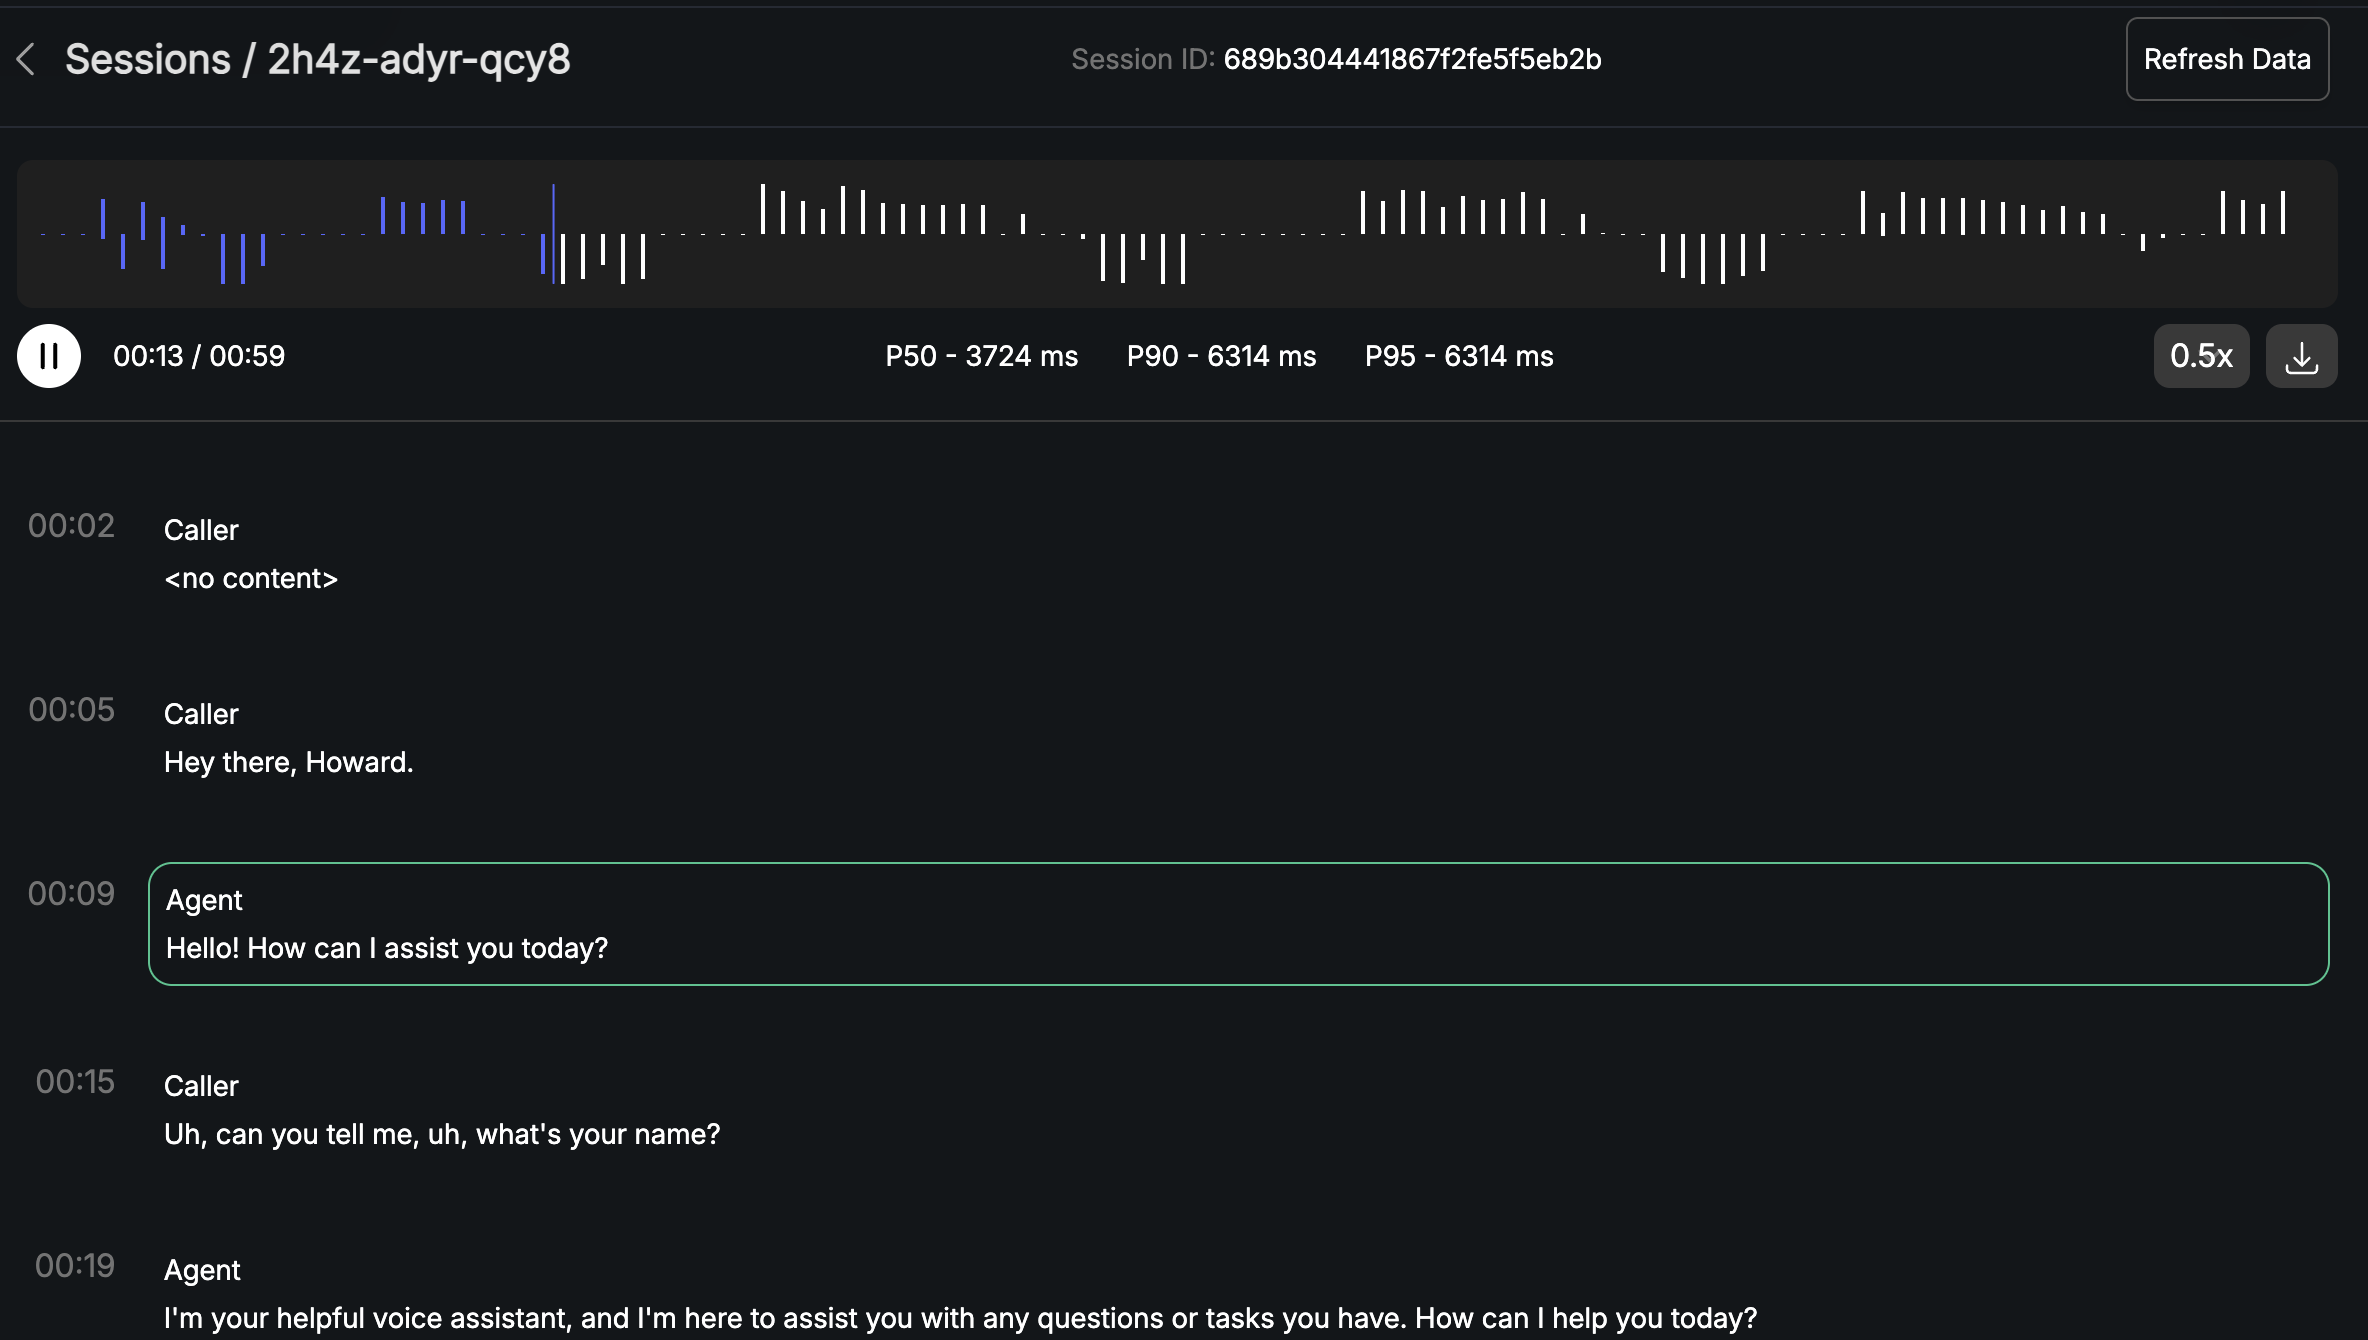
By clicking on "View Analytics" for a specific session, you are taken to the Session View. This view provides a complete transcript of the conversation, along with timestamps and speaker identification (Caller or Agent).

If the session was recorded, you can play back the audio and follow along with the transcript, which automatically scrolls as the conversation progresses. This is an invaluable tool for understanding the user experience and identifying areas for improvement.
By analyzing these metrics, you can quickly identify underperforming agents, diagnose latency issues, and gain a holistic view of the user experience. The next section will delve into the detailed session and trace views, where you can explore individual conversations and their underlying processes.
Got a Question? Ask us on discord

