Trace Insights
The real power of VideoSDK's Tracing and Observability tools lies in the detailed session and trace views. These views provide a granular breakdown of each conversation, allowing you to analyze every turn, inspect component latencies, and understand the agent's decision-making process.
Trace View
The Trace View offers an even deeper level of insight, breaking down the entire session into a hierarchical structure of traces and spans.
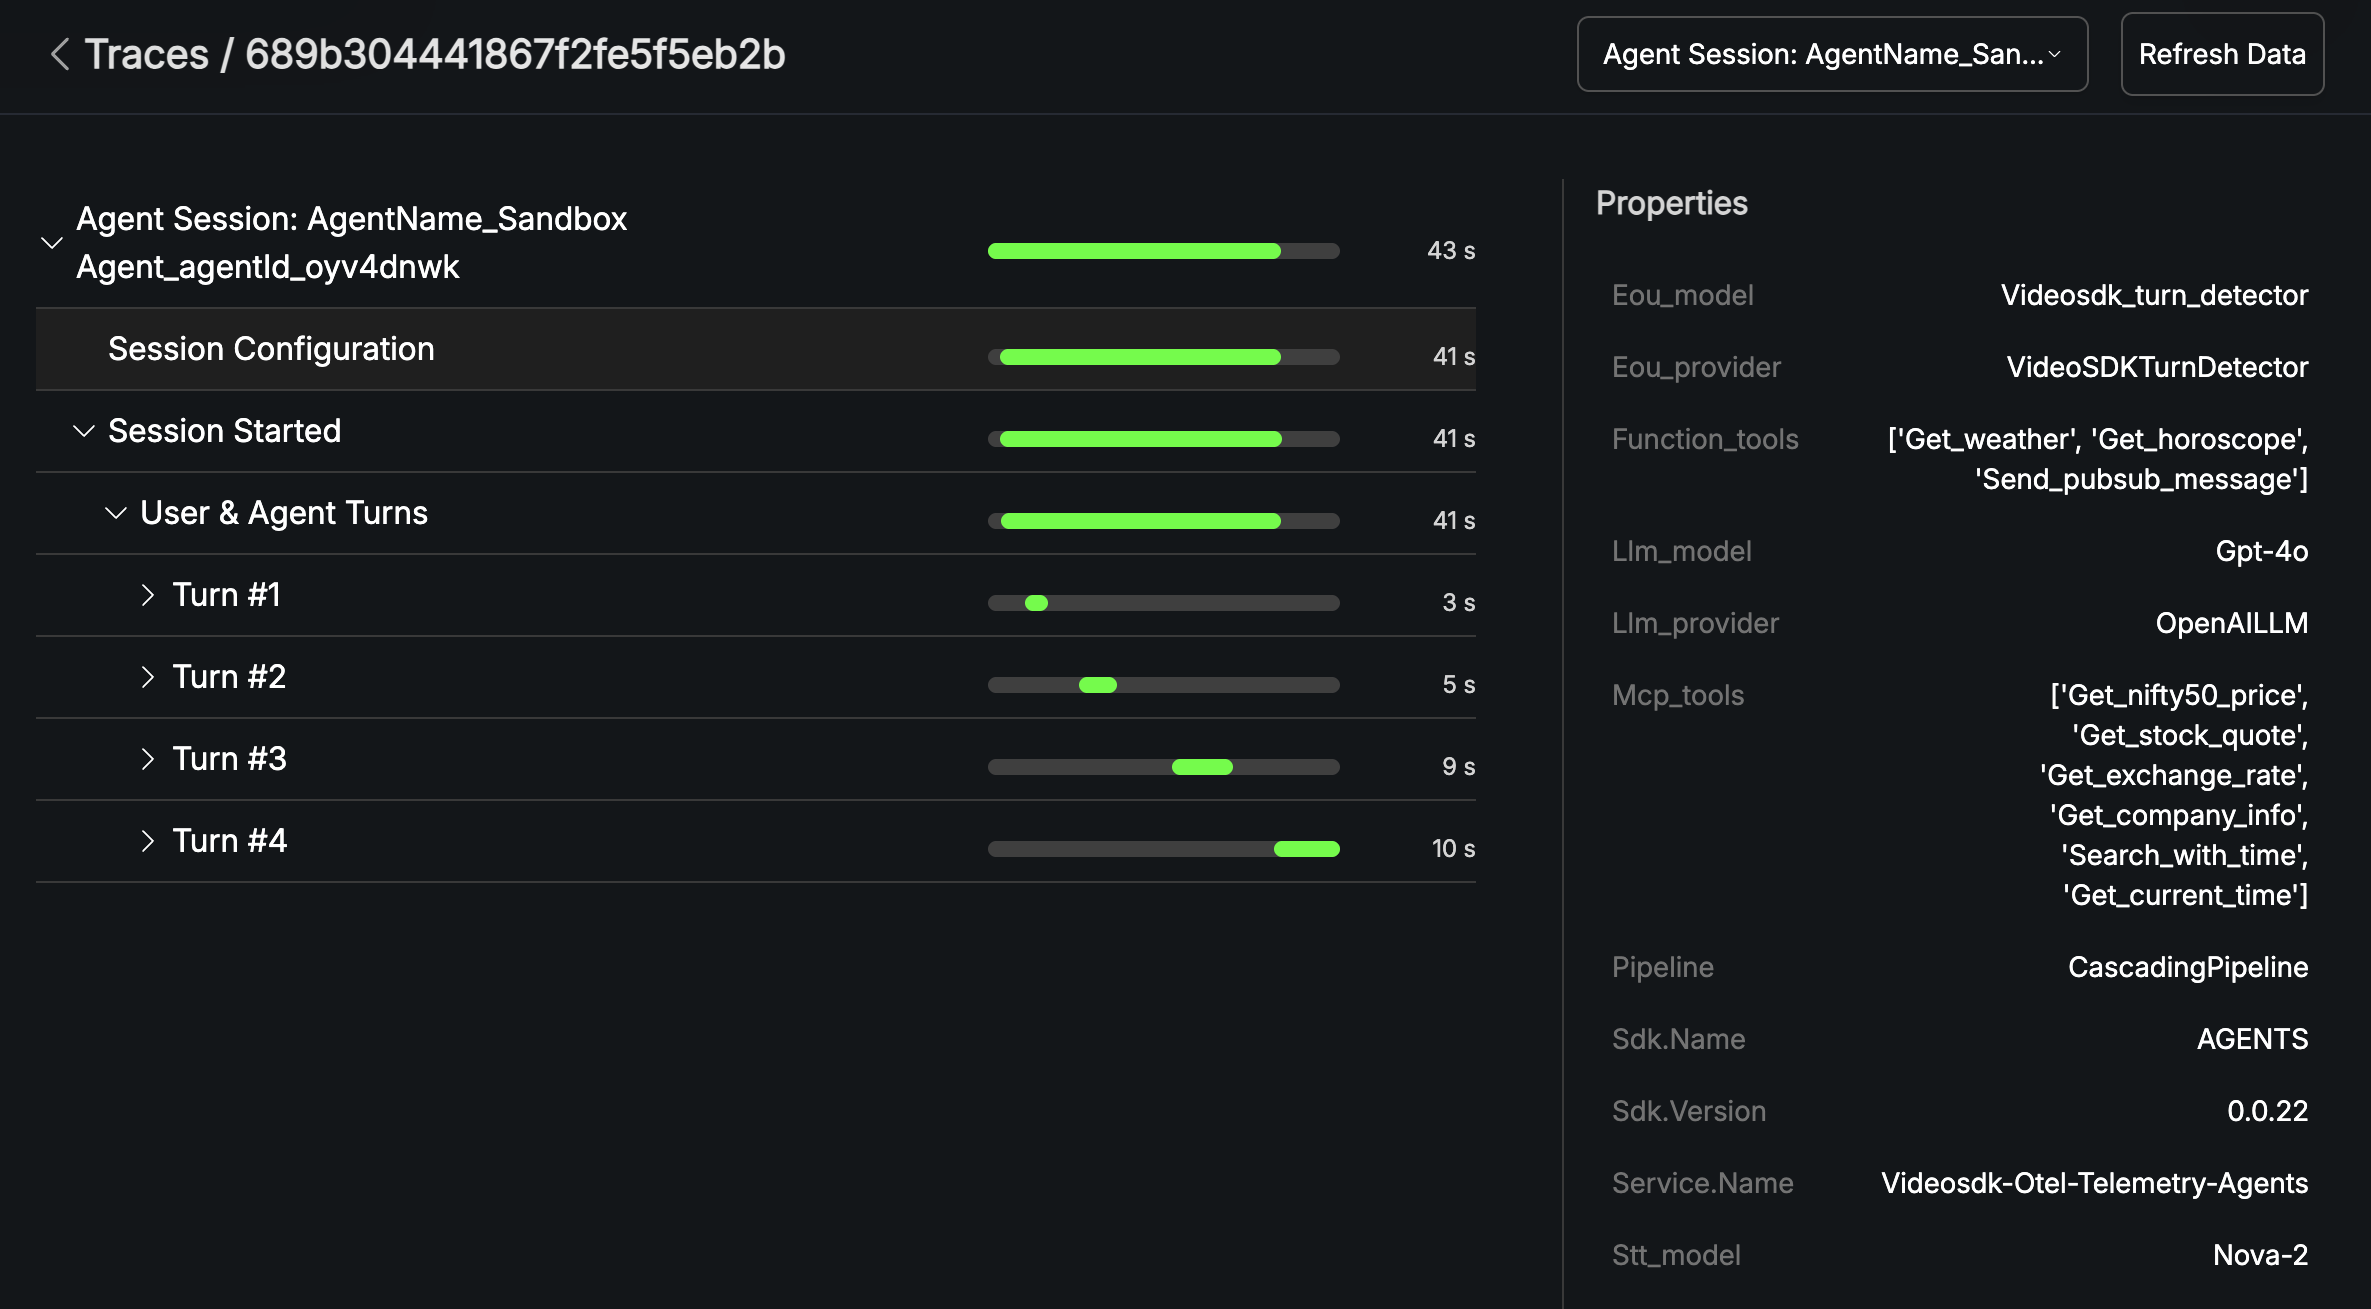
Session Configuration
At the top level, you'll find the Session Configuration, which details all the parameters the agent was initialized with. This includes the models used for STT, LLM, and TTS, as well as any function tools or MCP tools that were configured. This information is crucial for reproducing and debugging specific agent behaviors.
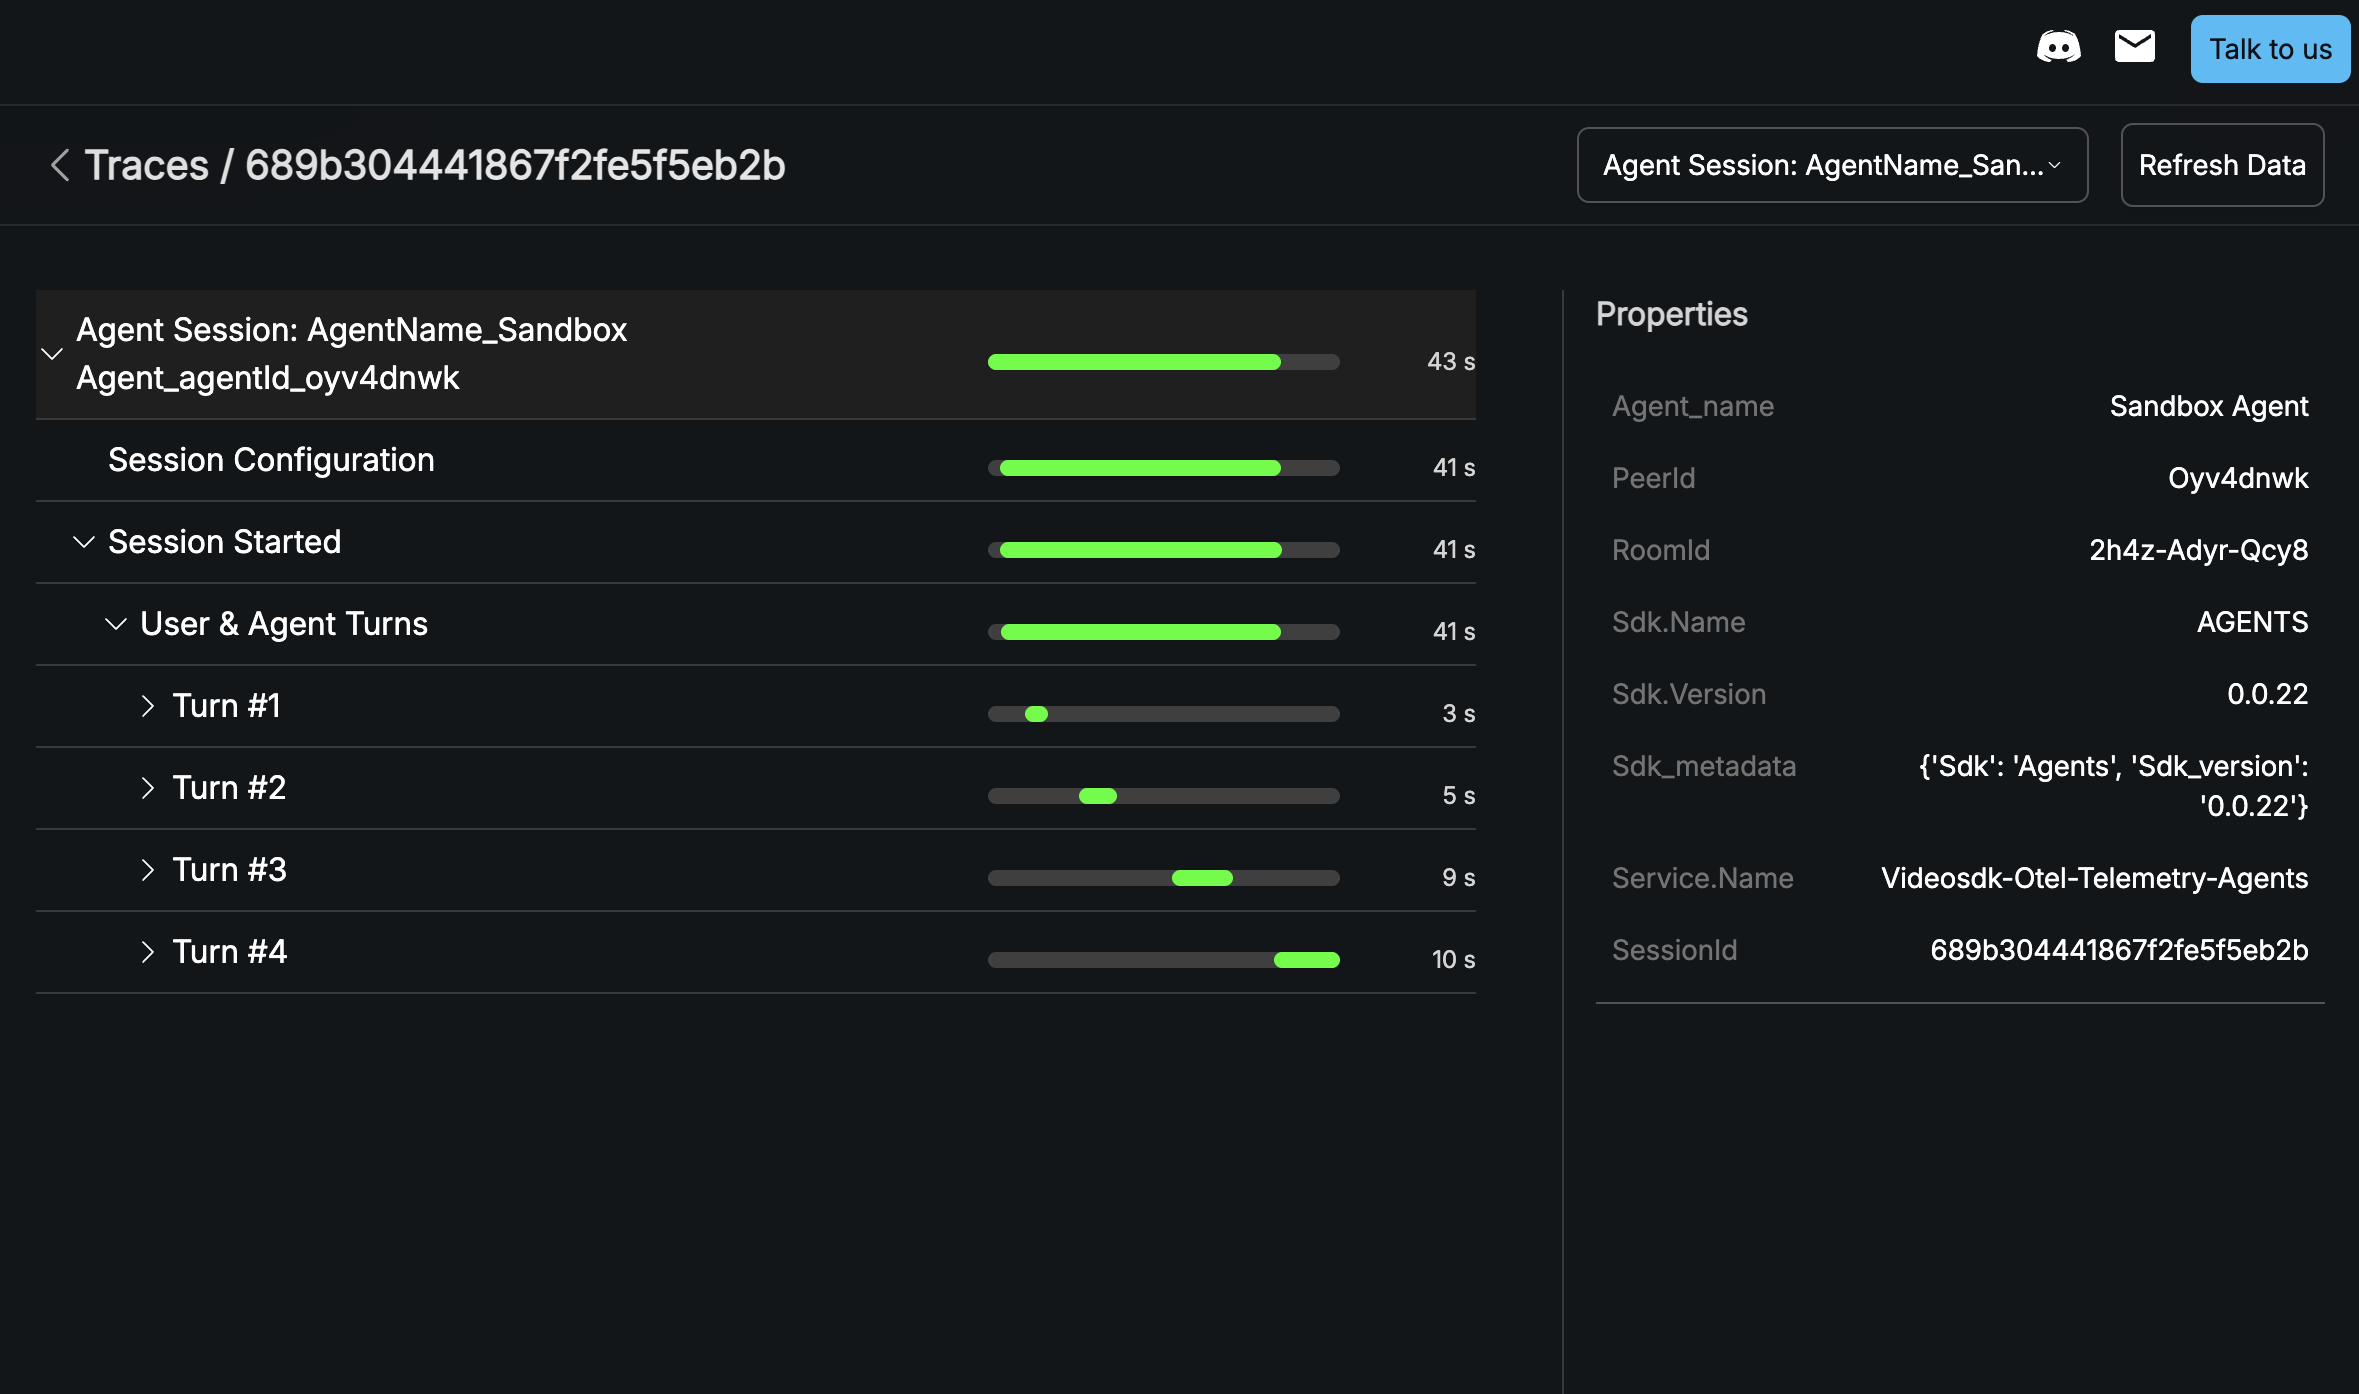
User & Agent Turns
The core of the Trace View is the breakdown of the conversation into User & Agent Turns. Each turn represents a single exchange between the user and the agent.
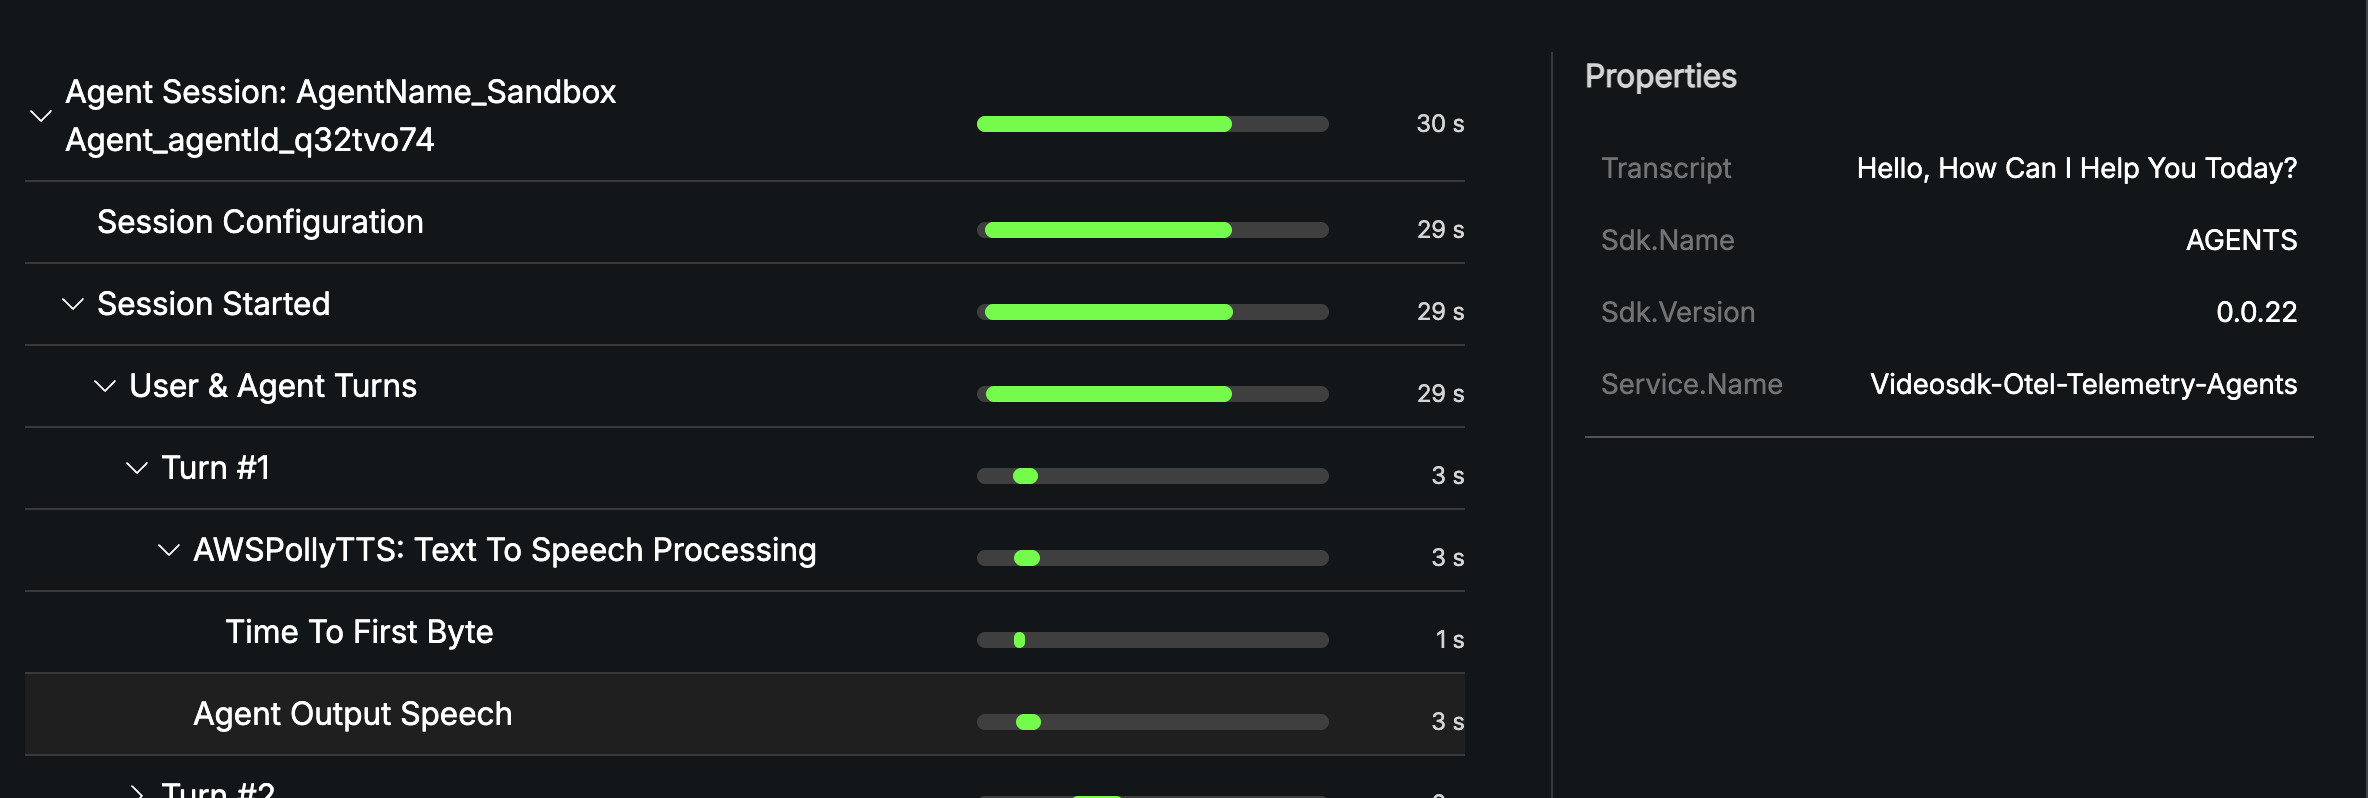
Within each turn, you can see a detailed timeline of the underlying processes, including:
- STT (Speech-to-Text) Processing: The time it took to transcribe the user's speech.
- EOU (End-of-Utterance) Detection: The time taken to detect that the user has finished speaking.
- LLM Processing: The time the Large Language Model took to process the input and generate a response.
- TTS (Text-to-Speech) Processing: The time it took to convert the LLM's text response into speech.
- Time to First Byte: The initial delay before the agent starts speaking.
- User Input Speech: The duration of the user's speech.
- Agent Output Speech: The duration of the agent's spoken response.
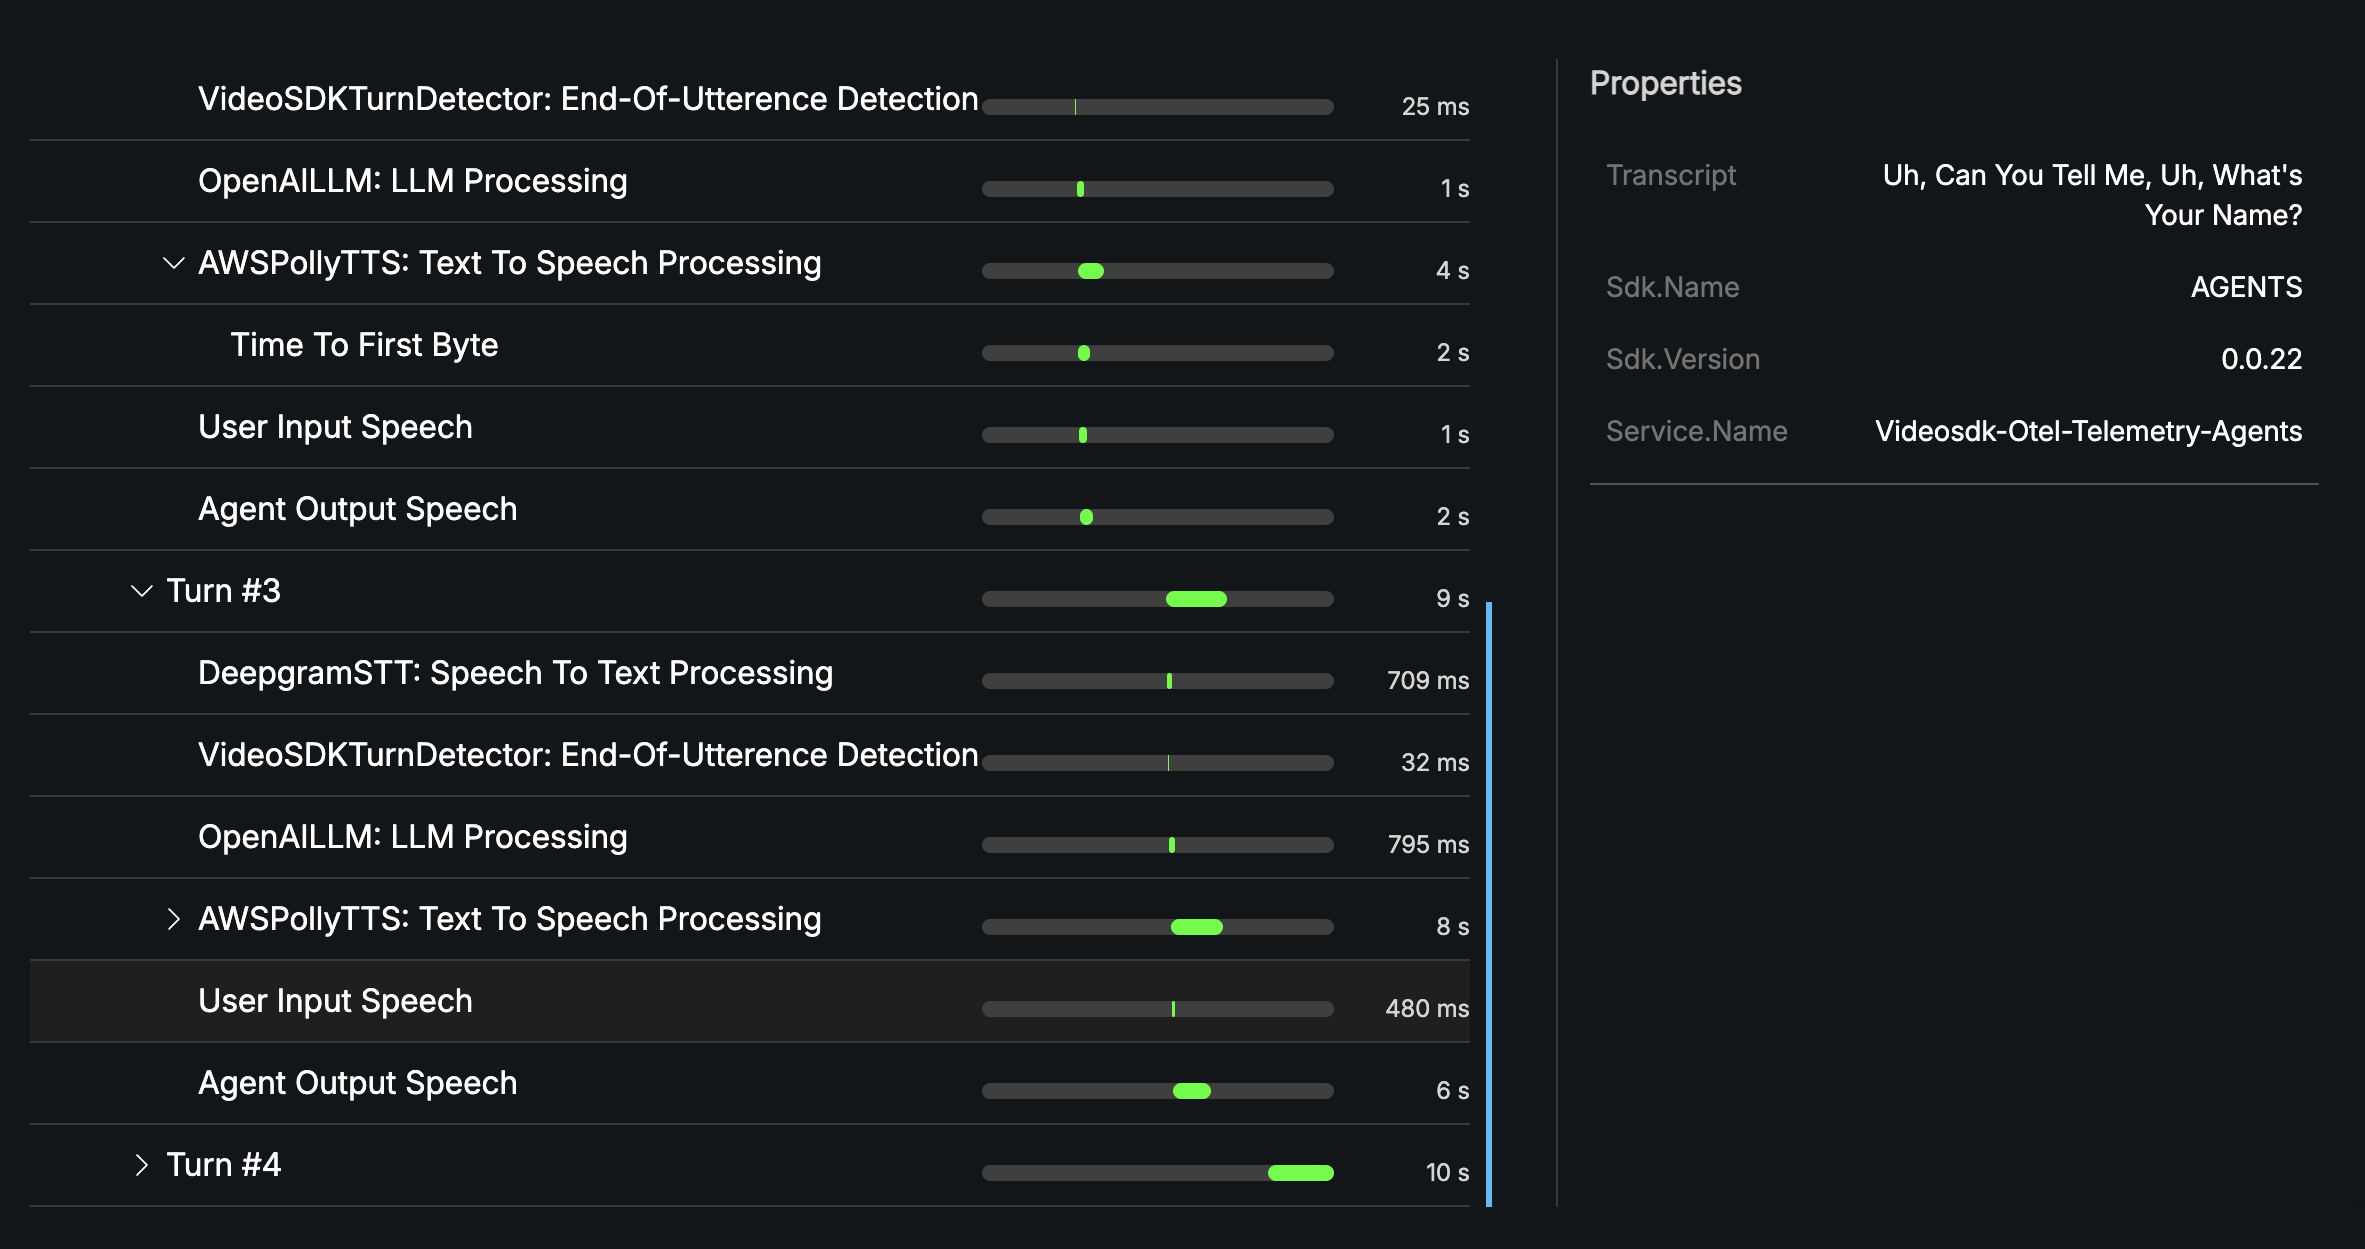
Turn Properties
For each turn, you can inspect the properties of the components involved. This includes the transcript of the user's input, the response from the LLM, and any errors that may have occurred.
By leveraging the detailed information in the Trace View, you can pinpoint performance bottlenecks, debug errors, and gain a comprehensive understanding of your AI agent's inner workings.
Tool Calls
When an LLM invokes a tool, the Trace View provides specific details about the tool call, including the tool's name and the parameters it was called with. This is essential for debugging integrations and ensuring that your agent's tools are functioning as expected.
Got a Question? ![]() Ask us on discord
Ask us on discord

