Participant Details
The Participant Details page provides connection, device, timeline, and media-quality information for an individual participant. Use it to investigate a participant's experience during a meeting session.
Open Participant Details
From the Session Overview, open a participant using either of these methods:
- In the graphical timeline, select View Details for the participant.
- In the participant table, select the arrow at the end of the participant's row.
Select Go back to participant list to return to the Session Overview.
Participant Summary
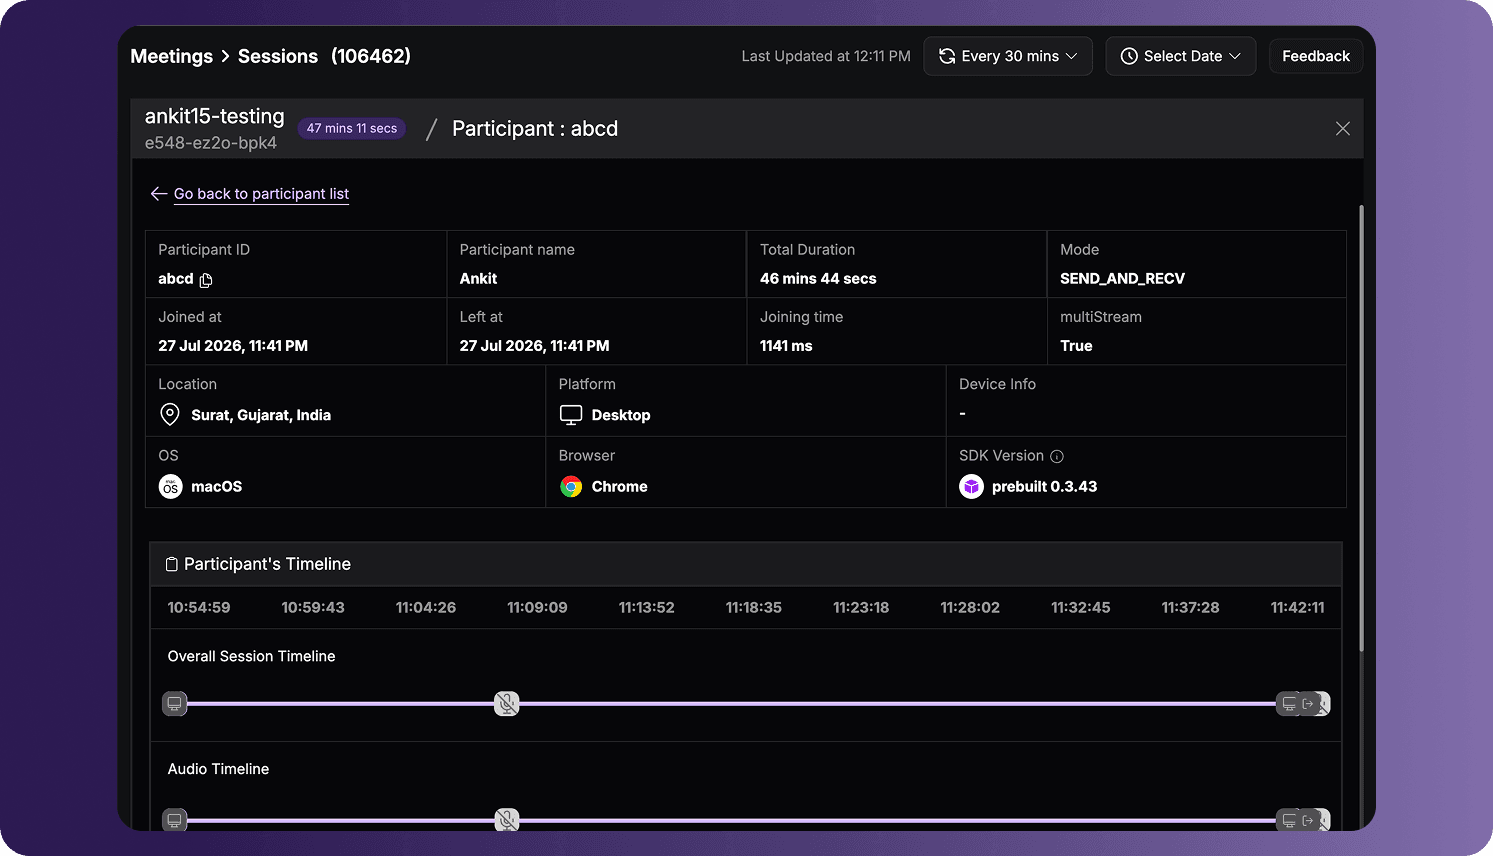
The page header identifies the meeting, its duration, and the selected participant. The participant summary provides the following information when available:
| Field | Description |
|---|---|
| Participant ID | The unique ID assigned to the participant. |
| Participant name | The participant's display name. |
| Total Duration | The total time the participant remained in the session. |
| Mode | The participant's meeting mode. |
| Joined at | The date and time when the participant joined the session. |
| Left at | The date and time when the participant left the session. |
| Joining time | The time taken by the participant to join the session. |
| multiStream | The multistream value recorded for the participant. |
| Location | The participant's approximate geographic location. |
| Platform | The type of platform used, such as desktop. |
| Device Info | Information reported for the participant's device. |
| OS | The operating system used by the participant. |
| Browser | The browser used by the participant. |
| SDK Version | The VideoSDK package and version used by the participant. |
Use the copy icon beside the participant ID to copy its value.
Participant's Timeline
The participant timeline places the participant's activity on the overall session time scale.
- Overall Session Timeline shows when the participant joined and left the session.
- Audio Timeline shows when the participant's microphone or audio stream started and stopped.
- Video Timeline shows when the participant's webcam or video stream started and stopped.
Hover over an event icon to view the event and its exact timestamp. The available timelines and indicators depend on the streams used and events recorded for the participant. For example, the video timeline can be empty or unavailable when the participant did not enable the webcam or joined an audio-only session.
Participant Call Health
The Participant Call Health section provides a quick view of the participant's media quality over time. Select Audio or Video to view the corresponding media type.

Hover over an interval to view the timestamp and its average:
- Jitter
- Round-trip time (RTT)
- Packet-loss percentage
Use this section to identify when the participant's connection quality changed during the session.
Participant Session Stats
Expand Participant Session Stats to inspect detailed media and device metrics. Select a media tab, then choose a Receiver Participant to compare the selected sender and receiver data.
The graphs place metric values on a session timeline. You can:
- Hover over a graph point to view its timestamp and exact value.
- Drag the handles below a graph to focus on a specific time range.
- Use the expand icon, when available, to enlarge a graph.
- Select Hide Session Stats to collapse the section.
The dashboard displays sender and receiver graphs side by side when data is available.
Stats by Media Type
- Audio
- Video
- Screenshare Audio
- Screenshare Video
The Audio tab displays the participant's audio-stream and device statistics.
| Metric | Description |
|---|---|
| Jitter | Variation in packet arrival time. Lower jitter generally indicates a more stable connection. |
| RTT / Latency | The round-trip time for data to travel between endpoints. Lower RTT generally indicates lower delay. |
| Packet-Loss Percentage | The percentage of audio packets that did not reach their destination. |
| Bitrate | The amount of audio data transmitted over time. |
| CPU Usage | The participant device's overall CPU usage percentage. |
| Memory Usage | The participant device's overall memory usage percentage. |
The Video tab displays the participant's video-stream and device statistics.
| Metric | Description |
|---|---|
| Jitter | Variation in packet arrival time for the video stream. |
| RTT / Latency | The round-trip time for data to travel between endpoints. |
| Packet-Loss Percentage | The percentage of video packets that did not reach their destination. |
| Bitrate | The amount of video data transmitted over time. Higher bitrate can support better video quality. |
| CPU Usage | The participant device's overall CPU usage percentage. |
| Memory Usage | The participant device's overall memory usage percentage. |
| FPS (Frames per second) | The number of video frames processed per second. |
| Resolution | The dimensions of the video stream. |
| Freeze Count | The number of times the received video froze. |
| Pause Count | The number of pauses detected in the received video. |
The Screenshare Audio tab displays network-quality statistics for audio shared with the participant's screen-share stream.
| Metric | Description |
|---|---|
| Jitter | Variation in packet arrival time for screen-share audio. |
| RTT / Latency | The round-trip time for screen-share audio data to travel between endpoints. |
| Packet-Loss Percentage | The percentage of screen-share audio packets that did not reach their destination. |
| Bitrate | The amount of screen-share audio data transmitted over time. |
The Screenshare Video tab displays network and visual-quality statistics for the participant's screen-share video stream.
| Metric | Description |
|---|---|
| Jitter | Variation in packet arrival time for the screen-share video stream. |
| RTT / Latency | The round-trip time for screen-share video data to travel between endpoints. |
| Packet-Loss Percentage | The percentage of screen-share video packets that did not reach their destination. |
| Bitrate | The amount of screen-share video data transmitted over time. |
| FPS (Frames per second) | The number of screen-share video frames processed per second. |
| Resolution | The dimensions of the screen-share video stream. |
Quality Thresholds
The dashboard categorizes supported metrics using the following thresholds:
| Metric | Good | Average | Bad |
|---|---|---|---|
| Jitter | Less than 15 | 15–30 | Greater than 30 |
| RTT / Latency | Less than 150 | 150–300 | Greater than 300 |
| Packet-Loss Percentage | Less than 1% | 2–5% | Greater than 5% |
| Freeze Count | Less than 5 | 5–10 | Greater than 10 |
| Pause Count | Less than 3 | 3–6 | Greater than 6 |
These thresholds are displayed by the dashboard alongside their corresponding graphs.
Unavailable or Inapplicable Data
No Data Available indicates that VideoSDK could not display the metric for the selected sender or receiver. The metric might not apply or the required data might not have been collected. For example, video metrics are unavailable when a participant did not enable video or joined an audio-only session. Screenshare metrics are unavailable when the participant did not share a screen, and Screenshare Audio metrics are unavailable when the shared screen did not include audio.
Some graphs can also indicate that a metric is not applicable for sender statistics. Available metrics can vary by participant, media type, platform, SDK, and session configuration.
Participant location, device information, timelines, and quality statistics depend on the data reported and collected during the session.
Got a Question?  Ask us on discord

