Session Stats
The Session Stats tab provides detailed media-quality and device-performance graphs for a meeting session. Use it to investigate changes in audio, video, and screen-share quality over time.
To open the tab:
- Sign in to the VideoSDK Dashboard.
- Select RTC and go to Sessions.
- Open a session record.
- Select Session Stats.
Session Stats are organized into four tabs:
- Audio
- Video
- Screenshare Audio
- Screenshare Video
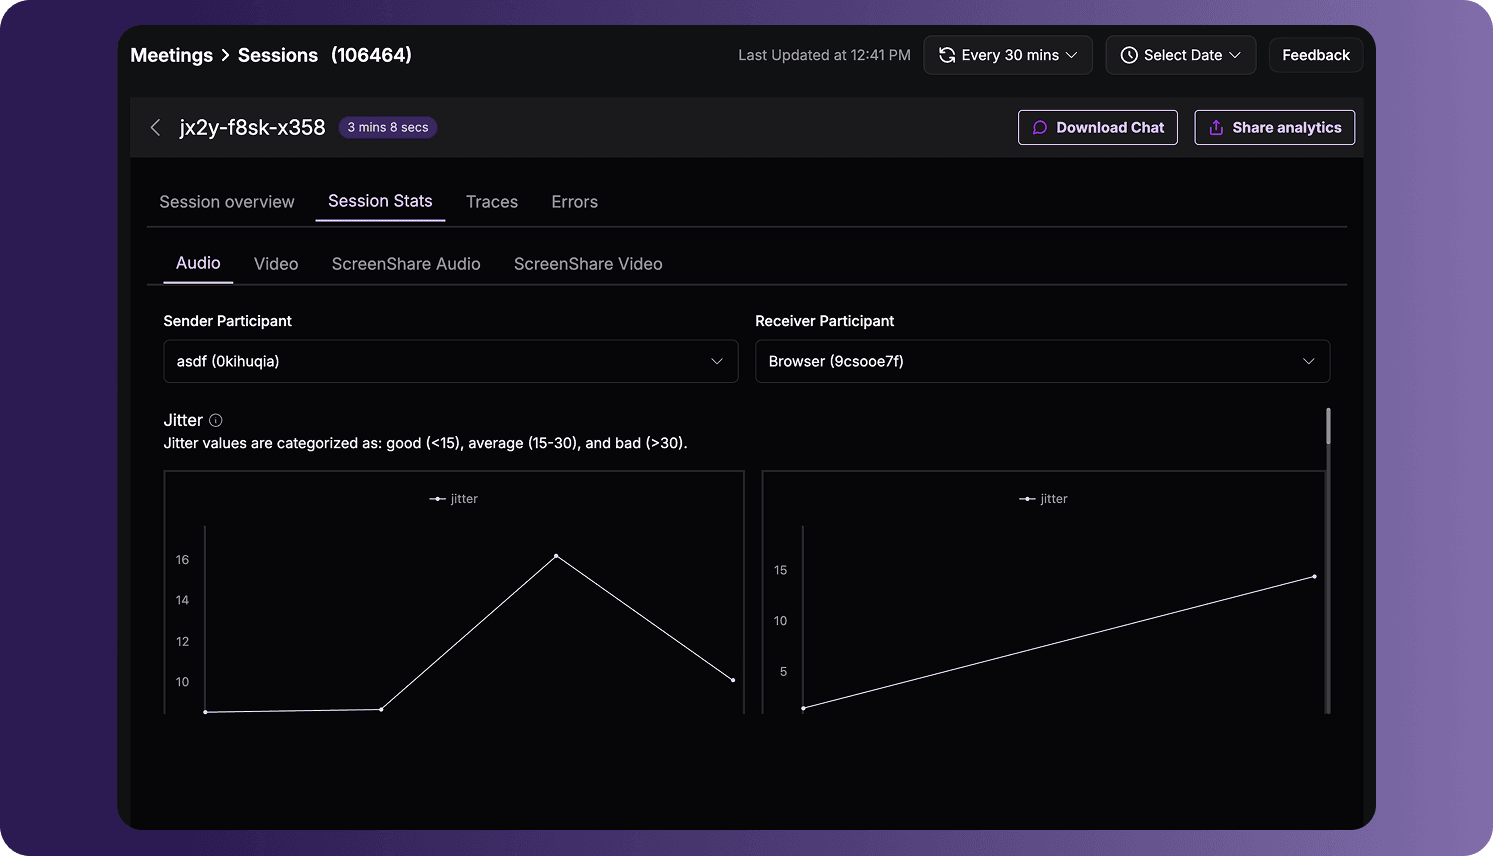
Work with Stats Graphs
The graphs plot metric values across the session timeline. Depending on the graph, you can:
- Hover over a point to view its timestamp and exact value.
- Drag the handles below the graph to focus on a specific time range.
- Use the expand icon to enlarge the graph when that option is available.
Stats by Media Type
- Audio
- Video
- Screenshare Audio
- Screenshare Video
The Audio tab displays statistics for audio streams in the session.
| Metric | Description |
|---|---|
| Jitter | Variation in packet arrival time. Lower jitter generally indicates a more stable connection. |
| RTT / Latency | The round-trip time for data to travel between endpoints. Lower RTT generally indicates lower delay. |
| Packet-Loss Percentage | The percentage of audio packets that did not reach their destination. |
| Bitrate | The amount of audio data transmitted over time. |
| CPU Usage | The overall CPU usage percentage reported by the participant device. |
| Memory Usage | The overall memory usage percentage reported by the participant device. |
The Video tab displays the same network and device metrics as the Audio tab, along with additional video-quality metrics.
| Metric | Description |
|---|---|
| Jitter | Variation in packet arrival time for the video stream. |
| RTT / Latency | The round-trip time for data to travel between endpoints. |
| Packet-Loss Percentage | The percentage of video packets that did not reach their destination. |
| Bitrate | The amount of video data transmitted over time. Higher bitrate can support better video quality. |
| CPU Usage | The overall CPU usage percentage reported by the participant device. |
| Memory Usage | The overall memory usage percentage reported by the participant device. |
| FPS (Frames per second) | The number of video frames processed per second. |
| Resolution | The dimensions of the video stream. |
| Freeze Count | The number of times the received video froze. |
| Pause Count | The number of pauses detected in the received video. |
The Screenshare Audio tab displays network-quality statistics for audio shared with a screen-share stream.
| Metric | Description |
|---|---|
| Jitter | Variation in packet arrival time for screen-share audio. |
| RTT / Latency | The round-trip time for screen-share audio data to travel between endpoints. |
| Packet-Loss Percentage | The percentage of screen-share audio packets that did not reach their destination. |
| Bitrate | The amount of screen-share audio data transmitted over time. |
The Screenshare Video tab displays network and visual-quality statistics for screen-share video streams.
| Metric | Description |
|---|---|
| Jitter | Variation in packet arrival time for the screen-share video stream. |
| RTT / Latency | The round-trip time for screen-share video data to travel between endpoints. |
| Packet-Loss Percentage | The percentage of screen-share video packets that did not reach their destination. |
| Bitrate | The amount of screen-share video data transmitted over time. |
| FPS (Frames per second) | The number of screen-share video frames processed per second. |
| Resolution | The dimensions of the screen-share video stream. |
Quality Thresholds
The dashboard categorizes supported metrics using the following thresholds:
| Metric | Good | Average | Bad |
|---|---|---|---|
| Jitter | Less than 15 | 15–30 | Greater than 30 |
| RTT / Latency | Less than 150 | 150–300 | Greater than 300 |
| Packet-Loss Percentage | Less than 1% | 2–5% | Greater than 5% |
| Freeze Count | Less than 5 | 5–10 | Greater than 10 |
| Pause Count | Less than 3 | 3–6 | Greater than 6 |
These thresholds are displayed by the dashboard alongside their corresponding graphs.
Unavailable Data
No Data Available indicates that VideoSDK could not display the selected metric. The metric might not apply or the required data might not have been collected. For example:
- Video statistics are unavailable when video was not enabled.
- Screenshare statistics are unavailable when screen sharing was not used.
- Screenshare Audio statistics are unavailable when the shared screen did not include audio.
The graphs and metrics available in each tab depend on the media used and the data collected during the session.
Got a Question?  Ask us on discord

